Interactive Map with Shiny and Leaflet
There are powerful tools for working with geographical data in R. For example, the ggplot and sf packages can be used together to display such data. But what about interactive maps which support panning, zooming, and clicks to trigger actions (e.g., highlighting an area)?
One way to accomplish this is through Shiny and Leaflet. With this combination of tools, it is relatively easy to stand up an graphical interface. Shiny supports constructs beyond routine R programming which allow variables, displays, and computations to react to user inputs. Leaflet provides widgets for interactive maps.
There are already a number of interesting examples on the web, but here is something I put together.
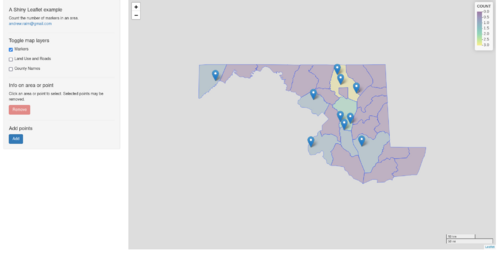
It displays counties in Maryland along with some randomly placed markers, and displays the count of markers within each county as a choropleth. Users can remove existing markers or add new ones, which in turn triggers the counts to be recomputed and the choropleth to be updated.
